Syndicated Research Report
Sponsorship Venues

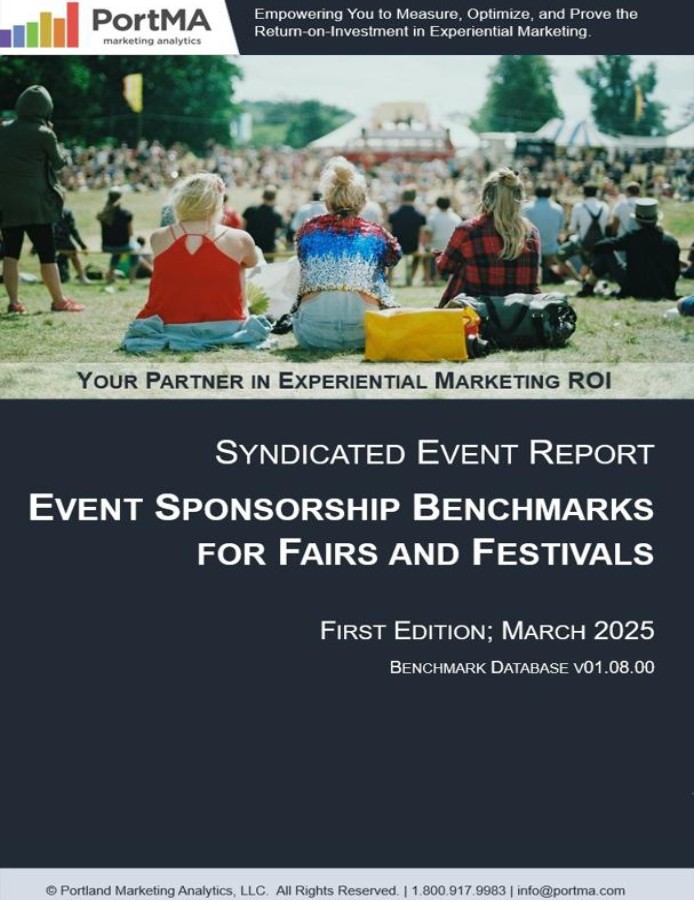
Fair & Festival Experiential Marketing Report

Benchmarks built from 71,168 consumer interviews across 680 fair & festival event days and $5.59M in sponsorship spend. The ROI data agencies and brand teams need to justify state fair, county fair, and outdoor festival activations — before budgets are committed.
Fair & Festival Experiential Marketing Report cover

The questions buyers use this data to settle

Decision-enabling benchmarks for fair & festival activations — RFPs, budget reviews, sponsor renewals, and campaign planning.

  • ? Which fair and festival venue types — state fairs, county fairs, outdoor music festivals — deliver the strongest cost-per-interaction benchmarks for my category?
  • ? At $2.00 per consumer interaction, how does fair & festival activation cost compare to destination venues and intercept programs — and when does the volume justify it?
  • ? What purchase intent lift and brand recall should I project when pitching a fair or festival activation to a CPG brand sponsor?
  • ? How does fair & festival audience dwell time and sampling conversion compare to other venue categories in the same sponsorship spend range?
  • ? Is our planned spend of $X realistic to reach Y consumer interactions across this fair footprint — and what does the benchmark data say?
  • ? Which consumer demographics convert at the highest rate at fair & festival activations, and how does that vary by product category and event type?
Data Scale — This Report
71.2K
Consumer
Exit Interviews
680
Event
Days Measured
2.8M
Consumer
Interactions
$5.59M
Sponsorship
Spend Analyzed

What the data shows

A selection of findings from this report. The full data set, segmentations, and methodology are available in the purchased tiers.

  • 01 Fair & festival activations achieve a cost-per-consumer-interaction of $2.00 across the full $5.59M spend dataset — the lowest cost-per-touch in the Sponsorship Venues category and a defensible benchmark for high-volume sampling programs.
  • 02 The dataset covers 680 measured event days across fair & festival venues, yielding approximately 105 consumer exit interviews per event day — a sample density that supports reliable segmentation by event type, geography, and product category.
  • 03 Fair & festival venues produce a cost-per-interaction of $2.00 — roughly half the destination venue benchmark ($4.51) — reflecting higher foot traffic density and audience volume characteristic of state fairs and outdoor festival footprints.
  • 04 With 2.8M consumer interactions benchmarked across 680 event days, the Fair & Festival report provides the volume-at-scale data brands need to model activation ROI before committing to multi-event fair season programs.
  • 05 The report delivers purchase intent lift, brand recall, and NPS benchmarks segmented by fair and festival subtype and product vertical — the specific metrics brand teams need to set pre-season targets and post-activation accountability standards.
$2.00
Cost per consumer interaction — this report

Derived from $5.59M in verified sponsorship spend across 2.8M consumer interactions. The lowest cost-per-touch in the Sponsorship Venues category — ready for budget defense and agency cost modeling.

Consumer exit interviews 71,168
Event days measured 680
Consumer interactions 2.8M
Sponsorship spend analyzed $5.59M

Built for the people who put data to work

CPG Brand Managers

Benchmark fair & festival activation costs against $5.59M in real spend data before approving state fair, county fair, and outdoor festival sampling programs.

Agency Account Directors

Win fair & festival RFPs with third-party ROI benchmarks — purchase intent, brand recall, and cost-per-interaction data at $2.00/touch that internal case studies can't match.

Event Producers

Set sponsor expectations with real engagement benchmarks from 680 measured event days — before the activation, not after the season ends.

Fair & Festival Organizers

Sell sponsorship packages with ROI data that makes the value conversation easy — and keeps sponsors renewing year after year.

Three ways to access the data

Start free. Upgrade when you're ready to put the numbers in a pitch deck.

Free Version
$0

Sample findings · no credit card

A curated selection of findings from the Fair & Festival report sent directly to your inbox. Enough to evaluate fit before you purchase.

  • 3–5 headline findings from this report
  • Data scale summary (interviews, spend, days)
  • Delivered via email within 1 business day
  • No commitment or credit card required

Your sample data will be available immediately after submission of a valid work email address.

Full Strategic Report
$1,295

One-time purchase · instant access

Includes 3 hours with a PortMA analyst to apply these benchmarks directly to your fair & festival campaigns.

Complete data set with cross-venue and cross-industry segmentations. For consultants and researchers who need the full picture on fair & festival ROI.

50+ segmented benchmark tables across demographics, venue subtype, and purchase cycle stages.

  • Everything in Executive Summary
  • Cross-industry segmentation analysis
  • Cross-venue comparison data
  • Raw benchmark tables by segment
  • Extended methodology and data appendix
  • 3 hours with a PortMA analyst (included)
PURCHASE — $1,295

100% of your purchase applies as credit toward any upgrade or future report.

Secure checkout via Stripe. PDF delivered immediately after purchase.

Upgrade to Bundle

Get this report as part of the Event Insights Pack — $3,395

3 reports at the Executive Summary tier for one lower bundle price — your purchase of this single report applies as credit toward the bundle. (Per-report total $2,085 · you save vs. buying separately.)

Talk to a PortMA Analyst

Not sure which tier is right for your use case? Our analysts can walk you through exactly how to apply fair & festival benchmarks to your campaigns.

Not ready to purchase? Start with the free sample.

We'll email a curated selection of findings from the Fair & Festival report — enough to know whether the data fits your pitch before you commit.

Request Free Sample Data
Aggregate Data Scale Across All PortMA Reports
283.7K+
Consumer interviews
across all reports
$94.6M+
Sponsorship & sampling
spend analyzed
24.4M
Consumer interactions
benchmarked
17 yrs
Collecting experiential
marketing data